

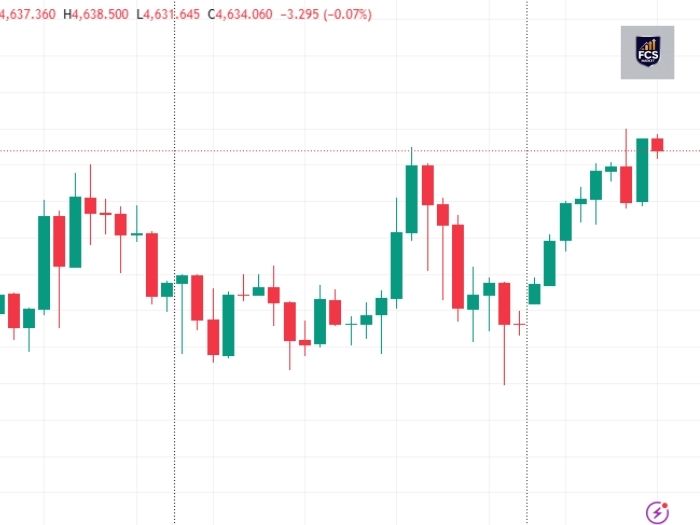
Gold Price Action : Gold’s recent movement against the US dollar reflects a market that is active, yet far from impulsive. Gold Price Action : The hourly chart of XAU/USD highlights a steady process of price discovery, where participation appears balanced and reactions remain measured. Rather than dramatic swings, the market is showing signs of structure, patience, and selective engagement.
This type of environment often provides more insight than high-volatility phases. It allows observers to understand how price behaves when neither buyers nor sellers feel rushed.
Gold Price Action: A Shift From Volatility to Stability
Earlier price action on the chart shows wider candles and quicker directional moves, suggesting heightened sensitivity. As the sessions progress, that behavior gradually softens. Candle sizes become more consistent, and price begins to move in smaller steps.
This transition suggests that the market is settling. Instead of reacting sharply, participants are reassessing value, allowing price to fluctuate within a more controlled range. Such phases often reflect adjustment rather than indecision.
Structure Is Becoming More Defined
One of the clearer observations is the presence of higher short-term lows. Each pullback finds support slightly above previous reaction points. Importantly, these recoveries occur without sudden spikes or aggressive candles.
This pattern points to steady participation rather than emotional momentum. Buyers appear willing to engage, but only within defined zones. That restraint contributes to a cleaner structure and keeps the market orderly.
Resistance Continues to Invite Interaction
On the upper side, price approaches an area where previous advances slowed. Each visit to this zone brings hesitation—small-bodied candles and brief pauses instead of sharp rejection or continuation.
This interaction shows respect for the level. The market is acknowledging resistance and testing it gradually, rather than forcing a move. Repeated interaction without strong rejection often signals evaluation rather than exhaustion.
Momentum Without Excess
Momentum on the chart exists, but it is controlled. Sequences of bullish candles appear, yet they are followed by shallow pullbacks instead of deep retracements. This rhythm suggests balance between initiative and response.
Such behavior often aligns with participation from a broader mix of market players. Moves develop through accumulation rather than bursts, keeping price from becoming overstretched.
Support Zones Are Holding Quietly
Several intraday pullbacks align with prior consolidation areas. Price slows as it enters these zones, then stabilizes. There is no aggressive selling pressure pushing price through support.
Read this also – Gold Pauses After Making Its Move
Quiet support is often more meaningful than dramatic rebounds. It reflects agreement among participants rather than panic-driven reactions. On this chart, support appears functional and respected.
Candlestick Clues Point to Negotiation
Individual candles show wicks on both sides near key areas. This indicates active negotiation between buyers and sellers. Neither side is dominating for long, reinforcing the idea of balance.
Read this also – When forex market open in India 2026
This candlestick behavior is common during phases where the market is comfortable with current pricing but still gathering information. It’s a process of confirmation, not conviction.
Why the Current Area Matters
The present price zone sits between recent recovery attempts and prior hesitation. That placement gives it contextual importance. The market is spending time here, observing reactions rather than rushing decisions.
Read this also –How to Start Forex Trading in 2026
Time spent at a level often signals acceptance. The longer price remains in a zone, the more relevant it becomes as a reference point for future behavior.
Conclusion
Gold’s recent price action reflects calm control rather than urgency. Structure is respected, momentum is measured, and key zones are being tested thoughtfully. This phase emphasizes observation over reaction and highlights the value of patience in understanding market behavior. For those focused on context rather than excitement, the chart offers a clear and composed narrative.
FAQs
1. What timeframe is used in this analysis?
The analysis is based on an hourly XAU/USD chart.
2. Is the market showing strong direction?
No, the chart reflects balance and gradual evaluation rather than a decisive move.
3. Why are higher lows significant here?
They suggest steady demand without aggressive participation.
4. Does this article give trading advice?
No, it focuses purely on observation and market structure.
5. Why is time at a price level important?
Time indicates acceptance and makes the zone more meaningful.