

The chart shows gold priced against the US dollar on an hourly timeframe, and the first thing that stands out is contrast. Earlier sessions were marked by steady, almost methodical movement. That tone changed sharply once price began accelerating higher in a compressed window of time.
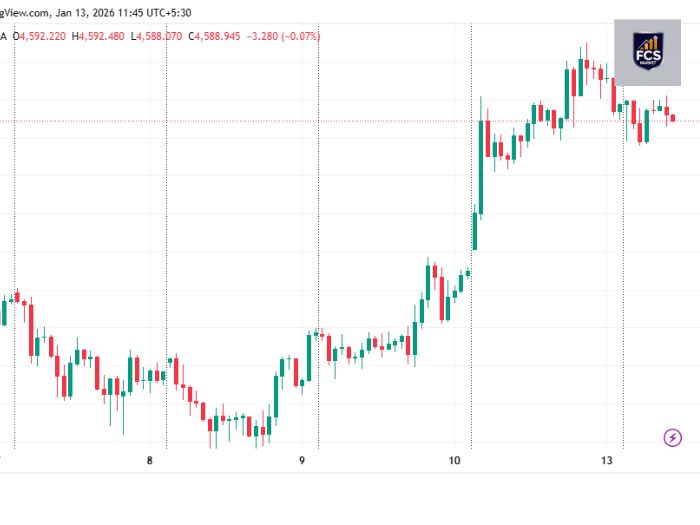
This was not a gradual climb. Candles expanded, momentum picked up, and the market shifted from balance into clear directional intent. From a structural perspective, this move disrupted the prior rhythm and reset expectations about short-term behavior.
Importantly, this change happened without immediate follow-through volatility. Instead, price advanced, paused, and then began to compress near the upper end of the range.
Gold: From Expansion to Compression
After the sharp upward impulse, the chart transitions into something more restrained. Candles become smaller. Wicks appear on both sides. Progress slows.
This type of behavior often reflects digestion rather than indecision. The market has already moved, and now it is processing that movement. Participants who were late to react are adjusting, while earlier positioning is being evaluated rather than aggressively unwound.
The absence of equally strong counter-moves is notable. There is no dramatic rejection, no fast retracement that erases the advance. Instead, price remains elevated, holding much of the prior ground.
Why This Zone Draws Attention
The current area matters because of context, not because of any single candle. Price is operating near the upper boundary of the recent structure, where momentum previously slowed.
Zones like this tend to attract attention because they represent a test of acceptance. The market is effectively asking whether higher prices can be maintained without renewed expansion.
This is not about calling a next move. It is about observing behavior. When price holds near highs without immediate continuation or sharp rejection, it often signals a transition phase rather than a conclusion.
That transition can take time, and the chart reflects that patience.
Momentum Has Shifted, Not Disappeared
Momentum on this chart did not vanish; it changed character. Earlier, momentum expressed itself through large candles and directional clarity. Now, it appears through resilience.
Despite multiple pauses, price does not collapse back into the prior range. Pullbacks remain contained, and rebounds, while modest, continue to respect higher ground.
This suggests that participation has slowed, not reversed. The market is quieter, but not directionless. The difference matters when interpreting structure rather than reacting to noise.
The Role of Intraday Structure
On an intraday timeframe, structure often tells more than indicators. Here, higher levels are being tested repeatedly without dramatic failure. Each attempt adds information, even when nothing seems to “happen.”
The market is no longer discovering prices rapidly. It is a negotiating value. That negotiation process often appears boring on the surface, but it is where longer-term clarity forms.
Read this also – When forex market open in India 2026
This is why patience becomes part of analysis. Not every important phase looks dynamic.
What the Chart Is Not Showing
Equally important is what is missing. There is no visible panic selling. There is no sequence of strong bearish candles that reclaim earlier levels. There is also no fresh surge that extends the prior move.
The absence of extremes keeps the narrative grounded. The market is neither confirming continuation nor signaling collapse. It is simply holding space.
For observers, this reduces the need for urgency. The chart encourages watching, not reacting.
Reading the Market as a Story
Seen as a story, the chart has three chapters. The first is balance and modest movement. The second is a decisive break higher. The third is consolidation at altitude.
Read this also – What is non farm payroll forex 2026
That third chapter is still being written. Its value lies in how price behaves within the zone, not in guessing how it will end.
For readers looking to understand gold rather than trade it aggressively, this context matters. Markets often spend more time digesting moves than making them.
Context Over Conclusions
This chart reminds us that strong moves are only part of the market’s life cycle. What happens after the move often carries more informational weight.
Read this also –How to Start Forex Trading in 2026
Gold is currently in a phase where structure, not speed, defines behavior. Observing how price respects recent gains, how volatility contracts, and how time is being used can be more instructive than focusing on any single outcome.
In moments like this, the market rewards patience and clear observation. The chart does not demand action. It invites understanding.